
One version of the numbers — and it updates itself
If month-end still starts with exporting three spreadsheets and ends with an argument about which one is right, the dashboard was never the problem. Everything upstream of it was.
- Pipelines & integration
- Warehouse modelling
- Automated reporting
- Data quality alerts

The reporting tax
“Two systems, two answers, one meeting to argue about it.”
Revenue means one thing in the CRM and another in accounting because nobody ever wrote the definition down. Agreeing the definitions is half of what fixes reporting.
“Closing the month takes days of copy-paste.”
Manual assembly is slow, but the real cost is that it is error-prone and never repeatable the same way twice — so nobody fully trusts the output, including the person who made it.
“Only one person understands the spreadsheet.”
The model that runs your business lives on one laptop with formulas nobody else can follow. That is a single point of failure with a notice period.
“By the time we see a number, it’s history.”
Data that is a month stale can explain what happened but can’t change it. Refreshed pipelines move reporting from post-mortem to something you can actually steer with.
What we build
The full path from the systems where your data is born to the screen someone actually opens on Monday morning — automated end to end.
Ingestion & integration
Pulling from your CRM, accounting, e-commerce, point of sale, spreadsheets, APIs and flat files on a schedule — reliably, with retries and failure alerts instead of silent gaps.
Cleaning & validation
De-duplication, entity matching, type and range checks, and rules for the messy real-world cases — so a single customer with four spellings stops being four customers.
Warehouse & modelling
A properly modelled warehouse with the business definitions written down and enforced in one place, so every report is computing the same metric the same way.
Automated reporting
The recurring reports your team assembles by hand — daily operations, weekly pipeline, month-end packs — generated and delivered on schedule, to inbox, Slack or the browser.
Dashboards people use
Built around the decisions they support rather than everything that could be plotted. Fast to load, readable on a phone, and honest about what the number does and doesn’t include.
Data quality monitoring
Freshness, volume and anomaly checks that alert you when a feed breaks — so you find out from a notification, not from a customer or a board meeting.
What you actually get
A reporting stack that runs unattended, with the definitions documented — so it stays understandable long after the engagement ends.
Scope this with us- A documented inventory of every source system and what it holds
- A modelled warehouse with scheduled, automated refresh
- A data dictionary with definitions your team has signed off on
- Dashboards and scheduled reports for the decisions that recur
- Freshness and anomaly alerts on every pipeline
- Full code, infrastructure-as-code and IP handover
From first call to handover
- 01
Inventory the sources
Where every number is born, who maintains it, how it can be accessed, and how much of it there is. This step alone usually surfaces two or three systems nobody remembered were feeding the reports.
- 02
Agree the definitions
What counts as an active customer, when revenue is recognised, which date matters. We write them down and encode them once, centrally — this is the step that ends the “which number is right” argument.
- 03
Build the pipeline
Ingestion, cleaning, validation and modelling as versioned code with tests — not a chain of manual exports. Repeatable, reviewable, and able to be re-run over history when something changes.
- 04
Publish and monitor
Dashboards and scheduled reports go live with quality alerts behind them, plus a walkthrough so your team knows what each number means and where it came from.
Data Transformation in the real world
Data Transformation earns its keep anywhere the reporting is assembled by hand or the systems disagree with each other:
Retail & e-commerce
Sales, inventory, ad spend and marketplace data joined into one margin-by-product view that refreshes itself daily.
Professional services
Utilisation, realisation and project profitability pulled straight from time tracking and invoicing — no month-end spreadsheet marathon.
Construction & trades
Job costing that combines labour, materials and change orders while the job is still open and something can still be done about it.
Logistics & distribution
On-time delivery, carrier cost and exception rates tracked across systems that were never designed to talk to each other.
Nonprofits
Grant and program reporting assembled automatically from donor, finance and program systems, in the format each funder demands.
SaaS & subscription
Retention, expansion and cohort metrics computed once from a defined source of truth instead of three teams each maintaining their own.
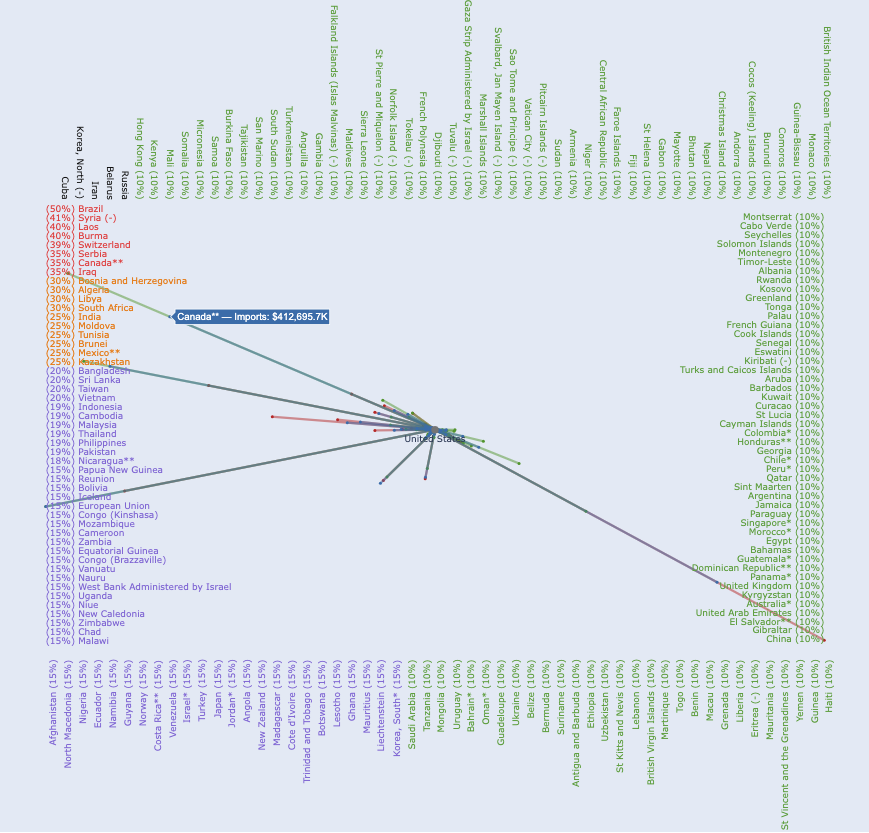
Over 324,000 rows, made legible
The Trade War Dashboard analytics layer sits on a curated tariff dataset covering roughly 200 economies plus historical UN Comtrade-derived trade data — more than 324,000 rows across the principal files — surfaced as an interactive, country-level view anyone can actually navigate. Big, messy, public data turned into something you can answer a question with.
Read the case studyTools & platforms we build Data Transformation on
- Python
- pandas
- dbt
- PostgreSQL
- Snowflake
- BigQuery
- AWS S3
- AWS Glue
- AWS Lambda
- Plotly & Dash
- Power BI
- Looker Studio
Data Transformation — questions we get asked
Do we have to move off our current tools?
Our data is genuinely messy. Is that a problem?
Snowflake, BigQuery, or just Postgres?
How fresh will the numbers be?
Can you fix our existing dashboards instead of rebuilding everything?
Who maintains it afterwards?
Most engagements touch more than one
A good automation usually needs clean data behind it and a decent interface in front of it. Here’s the rest of what we do.
Still assembling month-end by hand?
Bring one report you dread to a free 30-minute call. We’ll map out exactly what it would take to make it generate itself.
Free 30-min call · no commitment · you own everything we build